Every quarter, India’s GDP print arrives with the same ritual: a headline number, a round of triumphant government commentary, and — increasingly — a counter-narrative alleging the number is a fiction. The latest instalment, for April–June 2026, ran true to form. Real GDP grew 7.8%, comfortably beating both the RBI’s own 7% projection and the median 7.1% forecast from a Reuters poll of 58 economists. Within hours, a widely shared social media essay argued the true figure was closer to 4.4%, and that the gap was the product of statistical sleight of hand.
The truth, as usual, sits uncomfortably between celebration and conspiracy — and getting there requires taking apart the number piece by piece rather than either swallowing it whole or discarding it outright.
The deflator that wasn’t gamed
The critique rested on a single observation: GDP grew 10.3% in current prices but only 7.8% in real terms, implying a GDP deflator — the economy-wide measure of inflation used to convert nominal growth into real growth — of roughly 2.3%. That looked implausibly low next to retail inflation (around 3.9% for the quarter) and wholesale inflation (a startling 9.4%). Blend the two in a rough two-thirds-retail, one-third-wholesale ratio, and “effective inflation” comes out near 5.7% — more than double the implied deflator. Rework GDP using that number, and growth collapses to 4.4%.
It’s a clean, viral argument. It is also built on a mistaken premise: that the GDP deflator should track a simple weighted average of CPI and WPI. It doesn’t, and for good reason. The deflator is constructed from the price movements actually embedded in each component of GDP — consumption, investment, government spending, exports, imports — not from a blend of two survey instruments designed for entirely different purposes. And this particular quarter has an unusually clean explanation for why the deflator sits so far below both price indices: the WPI’s spike is concentrated almost entirely in Fuel & Power, up 27.4% year-on-year, driven by the crude oil shock from the West Asia conflict. Crude is an imported input. Imports are netted out of GDP by definition — higher-priced oil bought from abroad is not domestic value creation, however much it inflates the wholesale price index. Layer onto that the fact that services now account for the majority of India’s GVA, and services aren’t priced by WPI at all — they track something much closer to CPI, itself held down this year by GST rate cuts and government absorption of fuel costs at the pump. A blended deflator dominated by a majority-weight sector whose relevant inflation is running at 4–7%, not 9.9%, isn’t a mystery. It’s arithmetic.
The ghost that actually haunts India’s GDP data
None of which means Indian GDP data deserves a clean bill of health — it’s just that the real grounds for suspicion lie elsewhere, and they are considerably better documented than a single quarter’s deflator gap.
A decade ago, India ran the opposite inflation pattern to today’s: CPI near 10%, WPI near 5%. That gap had its own structural logic — food and protein-demand inflation (weighted nearly twice as heavily in CPI as in WPI), and a Baumol-style cost-push in labour-intensive services that WPI, being a goods-only index, simply cannot see. But that gap fed directly into a genuine and still-unresolved controversy. Under the pre-2015 methodology, roughly a fifth of India’s GVA — trade, hotels, transport, finance, real estate — was deflated using WPI manufacturing inflation as a proxy for services prices, on the assumption that goods and services move together. Arvind Subramanian’s 2019 study showed that assumption broke down after 2014, when CPI services inflation ran persistently above WPI manufacturing inflation. Deflating a fast-moving series with a slow-moving proxy mechanically inflates measured real growth. Subramanian put the overestimation at roughly 2.5 percentage points a year between 2011-12 and 2016-17 — a claim the government’s own Economic Advisory Council rejected sharply, and one a 2026 follow-up paper has since revised to a narrower, still real, 1.5–2 point overestimation for 2012-23 (alongside, intriguingly, likely underestimation during the 2005-11 boom).
The good news is that MOSPI appears to have partly absorbed the lesson: this quarter’s release is the first under a new 2022-23 base year that introduces double deflation for manufacturing GVA — separately pricing outputs and inputs rather than collapsing both into one proxy. It’s a genuine methodological improvement. The bad news is that other structural weaknesses remain unaddressed: WPI is still sitting on an old 2011-12 base even as CPI and GDP have moved on, and India’s former Chief Statistician, Pronab Sen, has openly flagged that corporate earnings this quarter aren’t tracking the headline manufacturing growth number — precisely the kind of divergence that made the original critique credible in the first place.
Who the growth belongs to
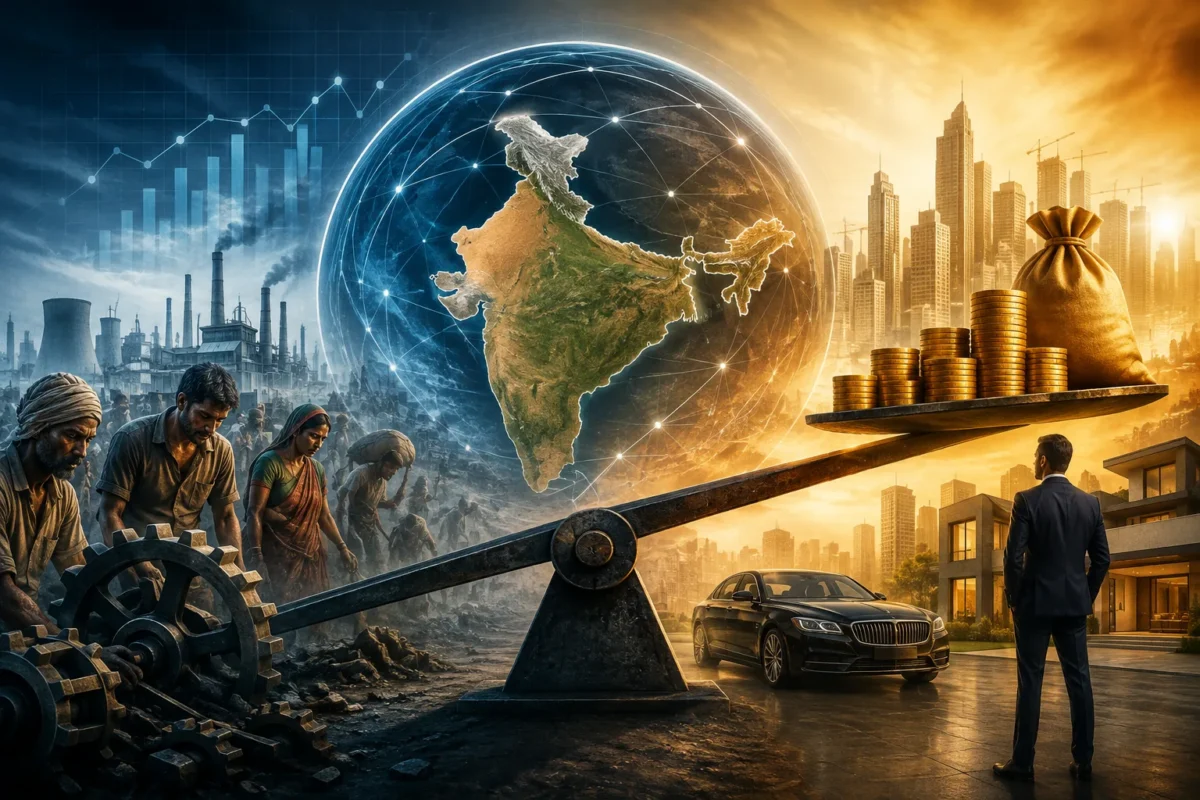
If the deflator story is mostly noise, a quieter and more consequential one runs underneath it. India’s growth this year is arriving alongside a widening gap between capital and labour that shows up in almost every series you check. The World Inequality Lab puts India’s top 1% income share at 22.6% and wealth share at 40.1% by 2022-23 — both historical highs, accelerating faster since 2014-15 than in earlier decades. Nifty 500 companies’ profit-to-GDP ratio has hit its highest level since before the 2008 crisis, with profit growth vastly outpacing employment growth at the same firms. Meanwhile, the Periodic Labour Force Survey shows real rural wages actually fell between 2017-18 and 2023-24, for both men and women. This quarter’s own corporate results tell a genuinely mixed story rather than a clean tale of margin capture — aggregate net profit up 16%, but on the fastest revenue growth in fifteen quarters and explicit commentary that margins are “feeling the heat” from costs, not expanding freely.
It would be a mistake, though, to call this straightforward immiseration. Consumption-side data tells a different story from wealth-side data: the 2022-23 Household Consumption Expenditure Survey shows falling inequality in both rural and urban consumption, and World Bank estimates put roughly 270 million people moving out of extreme poverty over the past decade. Both pictures are probably true simultaneously, and that is the more precise, more troubling story than either “growth is a lie” or “growth is fine.” The poorest are likely getting modestly, genuinely better off in absolute terms. The very top is pulling away at a pace that dwarfs that improvement. And the wage-earning middle — neither destitute nor enriched — looks largely stuck. That’s a K-shape, not an immiseration; the distinction matters, because the two point to very different policy remedies.
It is worth adding that the fiscal choices shaping this pattern are not simply a response to distress. Effective capital expenditure has risen structurally from 3.9% to 4.4% of GDP even as health’s share of the union budget has been declining since 2020, and agriculture — 43% of the workforce, roughly 18% of GDP — receives a ministry allocation of about 2.8% of total spending. Subsidies, notably, remain large and are rising, which complicates any claim that welfare has been abandoned; it has, rather, been reshaped, increasingly delivered through subsidy lines instead of expanded health and education budgets — a real compositional choice, made deliberately, not one forced by fiscal emergency, since the deficit itself (4.3% of GDP for FY27, the lowest since FY20) is on a consolidating path, not a stressed one.
An investment story built on borrowed foundations
The quarter’s actual growth engine was investment: gross fixed capital formation grew nearly 12%, its share of GDP climbing to 34.3%. That sounds like the long-awaited end of India’s private capex drought — a slump that has run, with only partial interruption, since the twin-balance-sheet crisis of the mid-2010s. The truth is more layered. Government capex — Centre, states, and public enterprises combined — grew nearly 17% and remains the dominant force behind the investment recovery of the past five years. There are, genuinely, fresh signs of private capital returning: capacity utilisation near 77%, a level that has historically triggered fresh capacity expansion in India; listed-company capex accelerating to 11% growth this year from 8%; RBI’s own survey projecting 21.5% growth in private corporate investment. But this revival, where visible, is narrow — concentrated in data centres and AI-linked infrastructure, power, metals, and now autos, renewables and defence — rather than a broad-based return of business confidence across the economy. Some of what counts nationally as “private” investment, moreover, is household spending on residential construction, a real-estate story more than a corporate-capacity one.
And the fiscal room that has allowed the government to keep leading on capex while also cutting GST rates and fuel duties has itself been partly manufactured by currency stress. The RBI’s record ₹2.87 lakh crore surplus transfer this year — funding much of this comfortable fiscal arithmetic — was substantially generated by the central bank selling dollars to defend a rupee that fell from roughly ₹83 to ₹96 against the dollar over the year, realising trading profits on reserves accumulated at a far lower historical cost. That is real, legitimately transferred revenue. It is also, transparently, a byproduct of the same capital-flight and current-account pressures — weak net FDI, US tariffs, an oil-driven import bill — that represent genuine vulnerabilities in the growth story, recycled through the central bank’s balance sheet into a fiscal cushion that will not repeat itself if the rupee stabilises.
The verdict, and where India sits among its peers
Put plainly: the 7.8% figure is not fabricated, but it deserves a wider error band than its precision implies, and its foundations are less durable than its headline suggests. On reliability, India occupies an uncomfortable middle ground — well short of China’s well-documented data-credibility problems, but a distance from the institutional trust enjoyed by the United States or the Eurozone, not helped by a live transition to a new base year and deflation methodology. On sustainability, this quarter’s growth leans on a one-off currency-driven fiscal windfall, a still-narrow private investment revival, and weak net foreign investment — fragilities that happen to rhyme with a broader global pattern this year, in which the IMF itself attributes resilient world growth largely to a narrow concentration of technology and AI-linked investment, most visibly in the United States. And on the long-term trend, the more important story than the growth rate itself may be the distributional one: real wages flat or falling for six years, capital income and asset values surging, and a government reshaping rather than expanding its welfare footprint even as fiscal space improves.
India remains, by a wide margin, the fastest-growing large economy on earth — 6.3 to 6.5% by IMF projections against China’s roughly 4.2–4.5%, the United States’ 2%, and the Eurozone’s little over 1%. That gap is real, and it matters. But growth-rate primacy answers a different question than the one that should follow it: not whether India is growing, which it clearly is, but who that growth actually belongs to — and on that question, the headline number has remarkably little to say.